The COVID-19 pandemic exposed a glaring flaw in humanitarian aid and development work: a dependence on centralized decision-making, non-local expertise and external resources. What happens when travel to and from major urban areas is cut off? How can we measure the impact of the work that is happening (or the impact of a crisis) if we cannot dispatch teams out to communities? For us, it revealed an inconsistency in how we approached community programming and how we approached shaping community relationships around data – we were lacking in the implementation of community-led principles within monitoring and evaluation.
At The Hunger Project (THP), Participatory Monitoring, Evaluation and Learning (PMEL or sometimes referred to as PM&E) became our solution. It is an adaptation of traditional assessment strategies for understanding progress, outcomes and impacts of a project, program or policy, that actively includes community partners in its processes. By enrolling stakeholders in assessing progress and outcomes, PMEL promotes community-led development by enhancing transparency, accountability and learning from the experiences of those directly affected by a project or program. This deeper integration of community partners into activities made us more conscious of what data we were collecting, its relevance to community partners and how much of that data made its way back into the community.
“The communities reported to The Hunger Project about the activities they were conducting through phones. They made sure they communicated with field staff on every activity and COVID-19 cases recorded in their communities since The Hunger Project could not visit the communities, ” reflects Henry Chungu, a Program Officer in Malawi.
PMEL is a critical approach for organizations to elevate the voices of marginalized communities. It provides an inclusive method that acknowledges the unique experiences and inherent expertise of these communities. By prioritizing their voices and perspectives, PMEL helps to ensure that programs and initiatives are better aligned with the needs and realities of the people who are part of these groups. Furthermore, PMEL invests in the capacity of local people to collect, analyze, and use data, thus supporting their ability to hold decision-makers accountable for benefits and rights they are entitled to as citizens.
By engaging community members in the MEL process, NGOs can gain a deeper understanding of the cultural and social context they are operating in and create more effective, targeted interventions. One of the strategies we leverage at THP to engage communities is called a ‘data walk’ an activity that we learned from the Urban Institute and started implementing in 2017. The activity invites communities to be thought-partners in program design and effectiveness to promote sustainable solutions and evidence-based action.
What is a Data Walk?
A data walk is a method for delving into and analyzing data with the goal of discovering patterns, trends, and revelations. At THP, we implement this activity after an evaluation by creating accessible visual representations of the results and inviting community partners to a meeting to analyze the collected data. Community partners participate in the activity by answering questions like ‘Do you agree with the results?’, ‘Did anything surprise you?’ and ‘What action should we take next?’, to discuss and reflect on the results. The process can be carried out by individuals or groups, and can encompass various forms of data, such as numerical, text, and spatial data.
Our Step-by-step guide for conducting a successful data walk:
- Define the data walk’s purpose and scope: Following an evaluation and prior to the data walk, the implementing team (MEL Officers, Program Officers) should clearly establish the purpose and boundaries of the data walk to stay focused on the given project’s objectives and concentrate on relevant data points for community partners to create informed opinions on progress and future adaptations. If feasible, community partners should also be invited to weigh in on the most relevant information to include.
- Organize the data and design the representations: Extract raw data, process and organize it, then convert it into a comprehensible format that community partners can easily interpret. At THP, this has typically involved taking quantitative survey data and developing simple, clear and accessible visualizations, assuring that they are translated into the appropriate language (see examples below). These visualizations can then be printed out as large posters.
- Establish key questions for discussion: Identify key questions that will help guide community partner focus and the discussion following their observations of the visuals. Standard questions we ask are: Do you agree or disagree with these results? Did anything surprise you? What actions should we take in response to these results?
- Organize and implement the data walk: After establishing the purpose, preparing the data representations and identifying discussion questions, organize a meeting time and location with community partners, inviting all relevant stakeholders. In the physical space, post the visualizations around the meeting location (e.g., on each wall of the meeting hall), and ask participants to walk around and observe the representations (this should appear similar to an art exhibit). If possible, have project staff stationed at each visualization to help answer questions. Participants should have enough time to look at each data representation.
- Sense-making discussion: Once each participant has had the opportunity to observe the results via the data representations, reconvene the group and invite a discussion on the key questions. Alternatively, you can begin with small discussion groups prior to forming the larger group discussion.
- Document your insights: A best practice is to have a discussion facilitator(s), presenting the questions and inviting responses, and notetakers, documenting responses and the process.
- Share and reflect on your findings: After the data walk is complete, share a verbal summary of the discussion with participants, assuring the documentation is consistent with their views of conversation.
- Learn and adapt: Use the insights discovered from the conversation with community partners to interpret project progress and impact, and adapt your implementation drawing from their suggestions on how to act upon results.
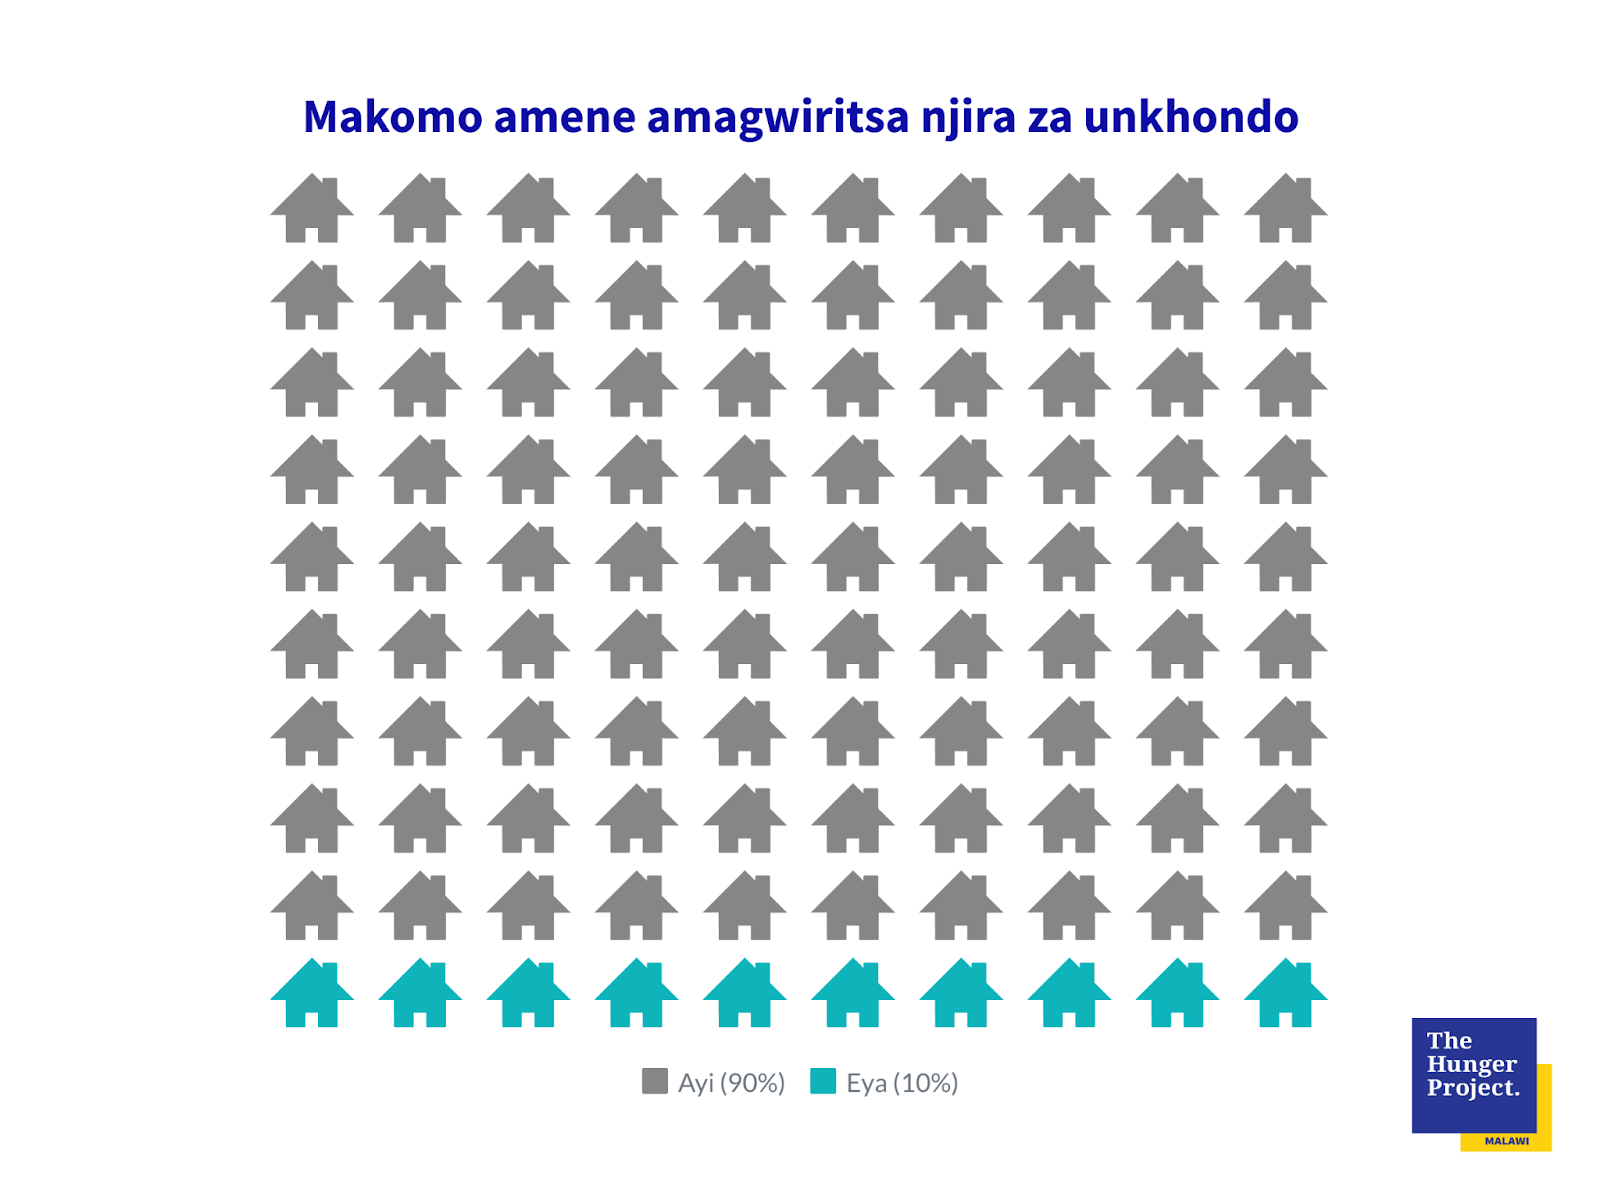
Data visuals used during a data walk, translated to the local language, Chichewa, in Malawi by The Hunger Project, 2022
What is the future of PMEL?
The aim is to design resources, tools and strategies to drive learning conversations within our organization, our implementing teams and progressively more, directly with our community partners. To succeed in this area, we have to lean into the accessibility of data-driven insights by creating data visualization tools and resources tailored to different stakeholders. We are designing these tools and resources with our community partners’ needs in mind and working with them to ensure that the tools are accessible and easy to use while providing the information that partners need to do their work effectively. We will also continue to build relationships with partners and work with them to assess the impact of our work.
At THP we are developing interactive and collaborative tools for implementing teams, such as dashboards that are fed data directly from our global database, and a mobile monitoring strategy using smartphones and tablets to provide faster and more actionable insights on programs. For community partners, we are using activities like data walks to ensure effective implementation of projects, identify issues, and provide feedback for future decision-making.
“It is a learning and reflective process for me. I use the data as a reflection on my life and household. For instance when I learned there was low school enrollment of school-going [aged] children, I told myself I should send my children to school so they become role models among their peers and I also become a model parent,” said Davis Amin, a community partner and participant during a data walk at Majete 6 in Malawi.
The PMEL approach involves investing in local capacities and knowledge, and empowering communities in times of crisis and stability. Local stakeholders should be involved in planning, implementation, assessment, and learning to enhance transparency, accountability, and ownership over program outcomes. Utilizing data visualization tools and strategies like data walks ensures community partners are thought leaders in evaluating program effectiveness. Embracing PMEL is essential for more inclusive, context-sensitive, and sustainable development practices, bridging the gap between organizations and the communities they serve for more impactful and successful interventions.
Learn more about The Hunger Project on www.thp.org
Article written by Pablo Sanchez and Debra Nhokwara
Images source: Data walk activity in Malawi by The Hunger Project, 2022.